|
|
|
In the lab you can do hands-on experiments. There are five experiments:
All experiments are realized with Java applets. They should run on any Web browser supporting Java. Sometimes the Java option is switched of. Be sure that it is switch on before running the experiments! Working with the applets should be rather intuitive. Nevertheless, reading the following instructions is recommended.
 All
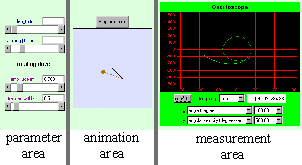
Java applets in the lab are organized like in this screen snapshot. In the center there is the
animation area where the motion of the pendulum is shown. On the left-hand side in the parameter area, various parameters can be changed. In the measurement area
either a stopwatch or an oscilloscope is available to measure certain properties of the system. All
Java applets in the lab are organized like in this screen snapshot. In the center there is the
animation area where the motion of the pendulum is shown. On the left-hand side in the parameter area, various parameters can be changed. In the measurement area
either a stopwatch or an oscilloscope is available to measure certain properties of the system. |
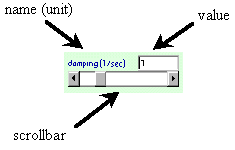
 The
parameter area shows control panels for several parameters. Each panel shows its verbal name (not the mathematical
one!) together with its physical units. Its actual value is shown in a text field. It can be changed either by
manipulating the scrollbar or by putting some numbers directly into the text field. Note, that parameters with
fixed values are not shown. The
parameter area shows control panels for several parameters. Each panel shows its verbal name (not the mathematical
one!) together with its physical units. Its actual value is shown in a text field. It can be changed either by
manipulating the scrollbar or by putting some numbers directly into the text field. Note, that parameters with
fixed values are not shown. |
 The animation
is stopped by pressing the stop button. The motion is resumed by pressing it again. Note, that stopping the animation
also stops the stopwatch and the oscilloscope. The motion is also stopped by clicking and dragging with the mouse
pointer inside the animation area. In addition, the position of the pendulum is also changed according to the mouse
pointer. Thereby, the angular velocity is put to zero. The actual value of the angle (in degree) is shown in the
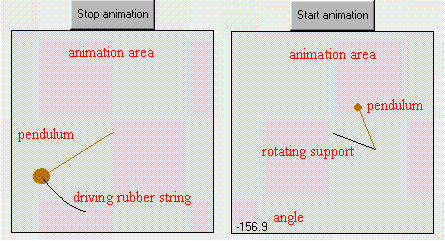
lower left corner. The driving mechanism is visualized in the following way:
A periodically stretched rubber band of zero equilibrium length shows driving
by a sinusoidal force (left part of the figure). A driven support is visualized by showing
the lever mechanism (right part of the figure). The animation
is stopped by pressing the stop button. The motion is resumed by pressing it again. Note, that stopping the animation
also stops the stopwatch and the oscilloscope. The motion is also stopped by clicking and dragging with the mouse
pointer inside the animation area. In addition, the position of the pendulum is also changed according to the mouse
pointer. Thereby, the angular velocity is put to zero. The actual value of the angle (in degree) is shown in the
lower left corner. The driving mechanism is visualized in the following way:
A periodically stretched rubber band of zero equilibrium length shows driving
by a sinusoidal force (left part of the figure). A driven support is visualized by showing
the lever mechanism (right part of the figure).
|
 Stopwatch:
It works similar to an ordinary stopwatch. It has three different phases which are indicated by the label
of the leftmost button. In the stopped state it shows "Start". In the running state it shows "Lap"
or "Run" depending on whether the display is updated constantly or not. In the stopped state the stopwatch
is started by pressing the leftmost button. The stop and the reset buttons stop the stopwatch. In addition the
reset button resets the display to zero. The simulation time runs parallel
to the physical time. Nevertheless, the stopwatch doesn't show the physical time
because stopping the animation also stops the stopwatch. Its like freezing the time. After animation
is restarted, the stopwatch runs again. The time increment is (roughly) given by the inverse frame rate which is 10Hz. Stopwatch:
It works similar to an ordinary stopwatch. It has three different phases which are indicated by the label
of the leftmost button. In the stopped state it shows "Start". In the running state it shows "Lap"
or "Run" depending on whether the display is updated constantly or not. In the stopped state the stopwatch
is started by pressing the leftmost button. The stop and the reset buttons stop the stopwatch. In addition the
reset button resets the display to zero. The simulation time runs parallel
to the physical time. Nevertheless, the stopwatch doesn't show the physical time
because stopping the animation also stops the stopwatch. Its like freezing the time. After animation
is restarted, the stopwatch runs again. The time increment is (roughly) given by the inverse frame rate which is 10Hz. |
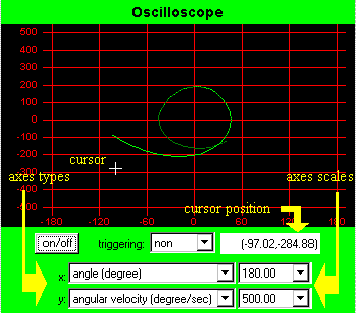
 Oscilloscope:
It is switch on by the on/off button. The type of triggering, the type of the x- and y-axis, and the scales of
the x- and y-axis can be chosen from choice menus. Putting the mouse into the black screen turns the default cursor
into a cross-hair cursor. In addition, its coordinates are shown. Oscilloscope:
It is switch on by the on/off button. The type of triggering, the type of the x- and y-axis, and the scales of
the x- and y-axis can be chosen from choice menus. Putting the mouse into the black screen turns the default cursor
into a cross-hair cursor. In addition, its coordinates are shown. When the x-axis is the time, the drawing of the curve is restarted at the left side of the axes box after it has leaved the box on the right side. If triggering is activated, drawing is restarted only if the trigger signal just crosses zero from negative values to positive values. In the case of internal triggering, the trigger signal is what is shown on the y-axis (i.e. the angle or the angular velocity). For external triggering it is the phase of driving. Note, that sometimes the pendulum may be in a dynamical state which never fulfills the trigger condition. In this case no curve is drawn. You may also miss the curve if the scale of the x-axis and/or y-axis are too small. When the x-axis is the angle, external triggering turns the oscilloscope into a Poincaré map (more precisely: a stroboscopic map). The Poincaré condition is just the trigger condition. Thus, each point on the screen corresponds to the angle and angular velocity of pendulum at always the same phase of driving. |